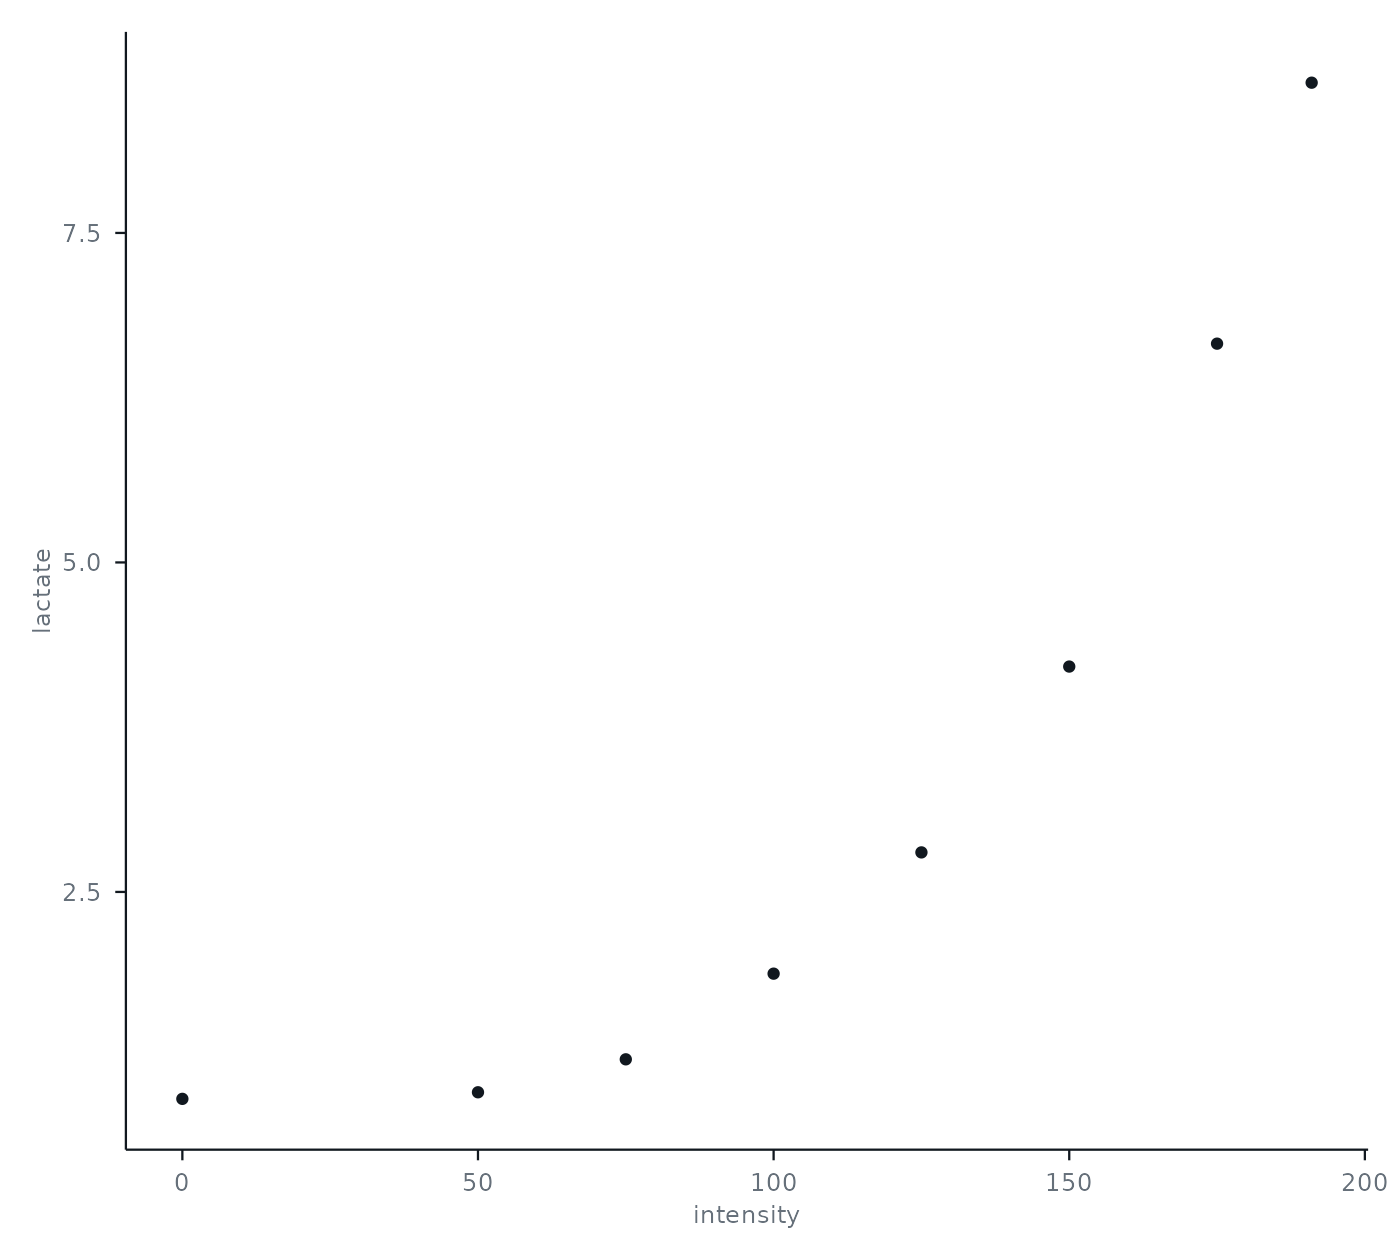
The theme used by every lactater plot: axis lines, no grid, and quiet text, so the lactate curve and the threshold carry the color. Use it to make your own plots match.
Details
Two options change every lactater plot:
options(lactater.style = "night")switches to a dark version, and"journal"to a quieter print look (an ink curve with one amber accent)."light", a blue curve with a green threshold, is the default.options(lactater.font = "IBM Plex Sans")sets the font of the text and the annotations. The font must be installed (seesystemfonts::require_font()).
The subtitle and the caption are text boxes from ggtext, so they wrap by themselves to the width of the plot.
Restyle them with ggtext::element_textbox_simple() rather than ggplot2::element_text(), which cannot replace
them.
Plots are ggplot2 objects, so anything else can be changed by adding layers, scales or a theme().
Examples
library(ggplot2)
ggplot(demo_data, aes(intensity, lactate)) +
  geom_point() +
  theme_lactater()