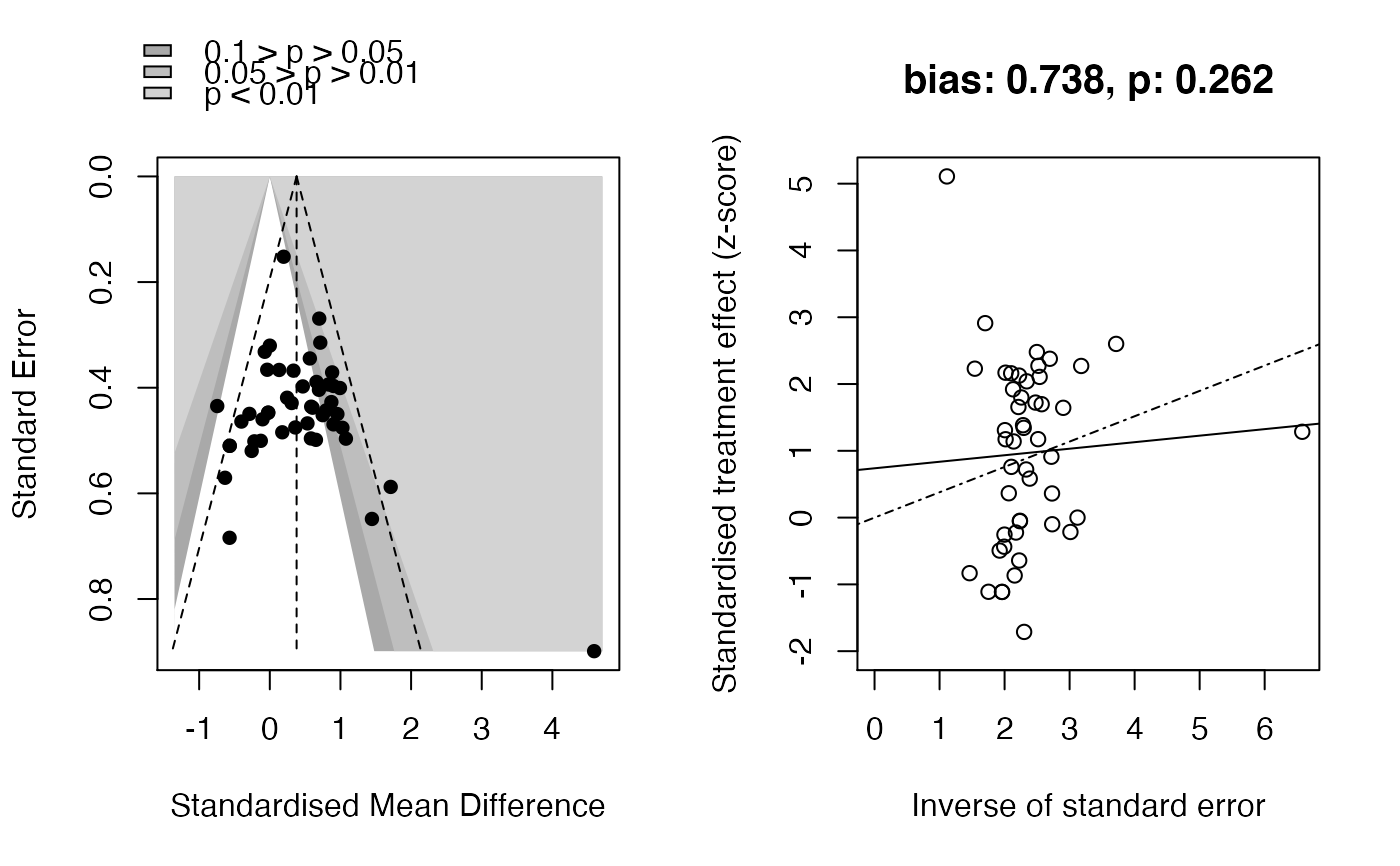
Plot small-study effects analysis
plot_small_study_effects(x, save = FALSE, path, format = ".png")
Arguments
| x | an object of class meta |
|---|---|
| save | A boolean to indicate whether to save the plot to disk. |
| path | Path to write to. It has to be a character string indicating the path and file name (without the extension). For example, |
| format | The file extension that you want to save the plot to. Only |
Value
a plot.
Examples
#>#> ✔ 'Overall'#> ✔ └─ Performing meta-analysis#> ✔ └─ Performing sensitivity analysis#> ✔ └─ Meta-analysis results are robust! Keep going!#> ✔ Performing meta-analysis and meta-regression on the Population subgroup#> ✔ Performing meta-analysis and meta-regression on the Age subgroup#> ✔ Performing meta-analysis and meta-regression on the Training Duration subgroup#> ✔ Performing meta-analysis and meta-regression on the Men Ratio subgroup#> ✔ Performing meta-analysis and meta-regression on the Type of Exercise subgroup#> ✔ Performing meta-analysis and meta-regression on the Baseline subgroup#> ✔ Performing meta-analysis and meta-regression on the Type of HIIE subgroup#> * DONE * ──────────────────────────────────# Plot small-study effects results results$meta_analysis$Overall %>% plot_small_study_effects()