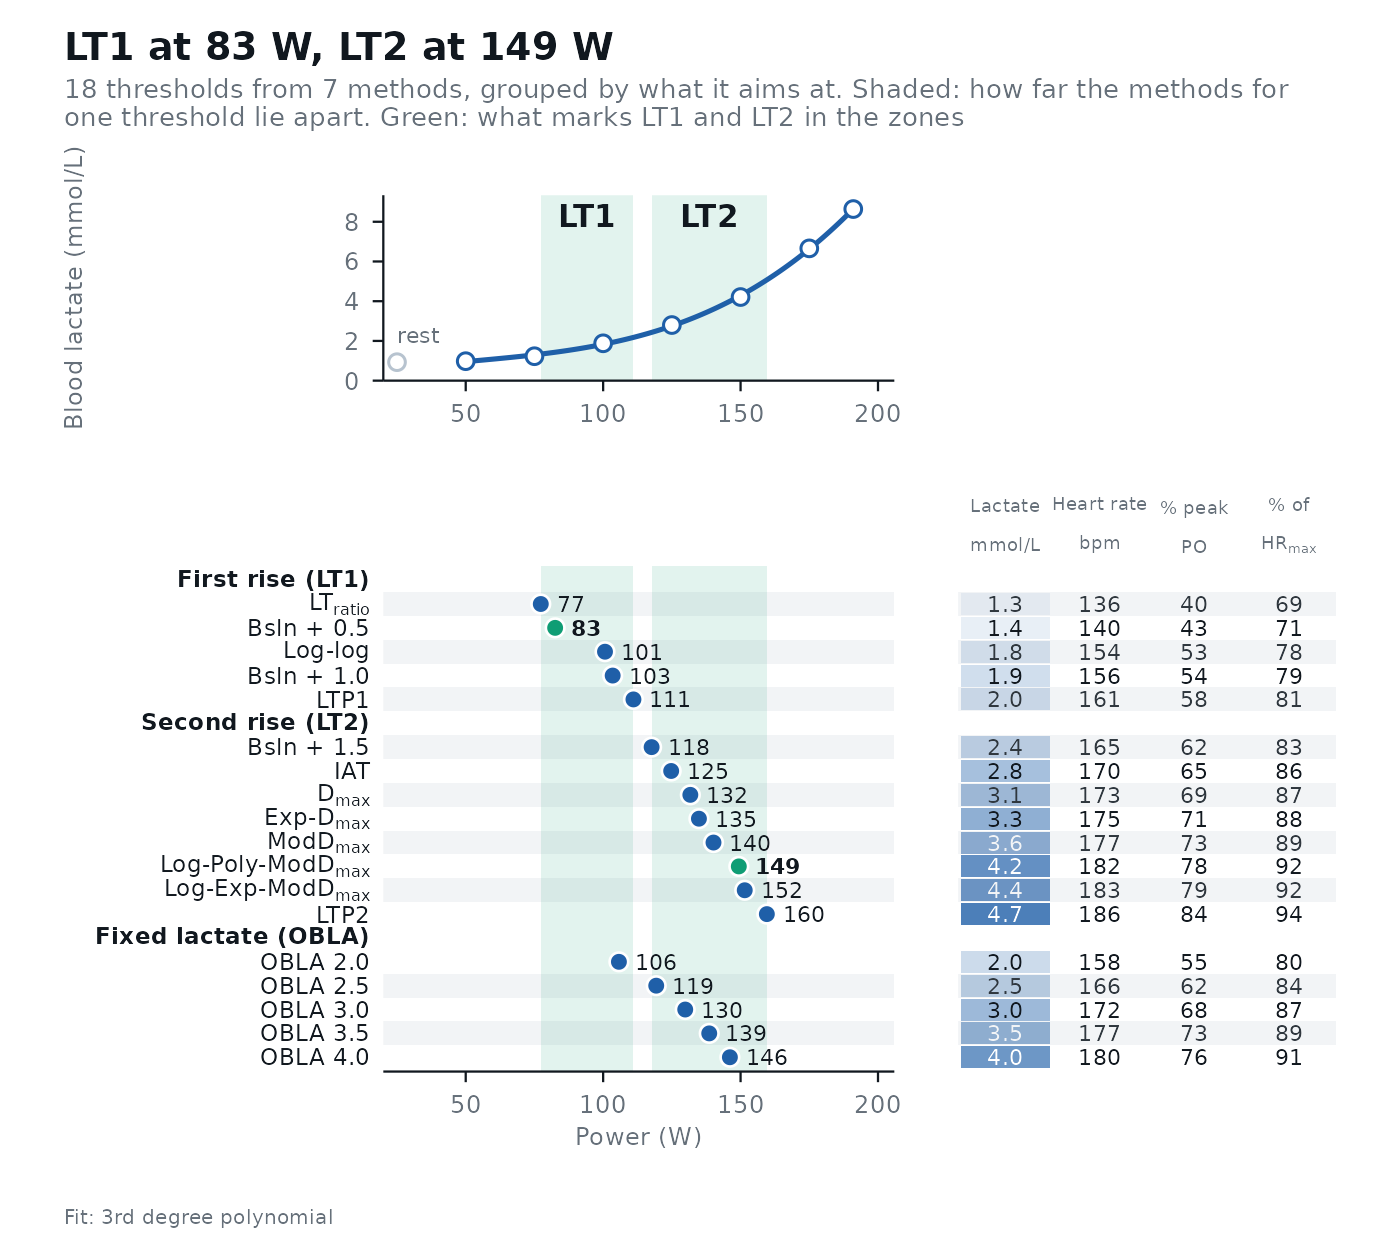
Plots the result of lactate_threshold(). Without method, an overview: the fitted lactate
curve on top and every threshold below, grouped by what the method aims at, on the same intensity axis, with a
shaded band for how far the methods aimed at LT1 and at LT2 lie apart, so you can see at a glance how much the
methods agree; the two that mark LT1 and LT2 (lt1, lt2, as chosen in
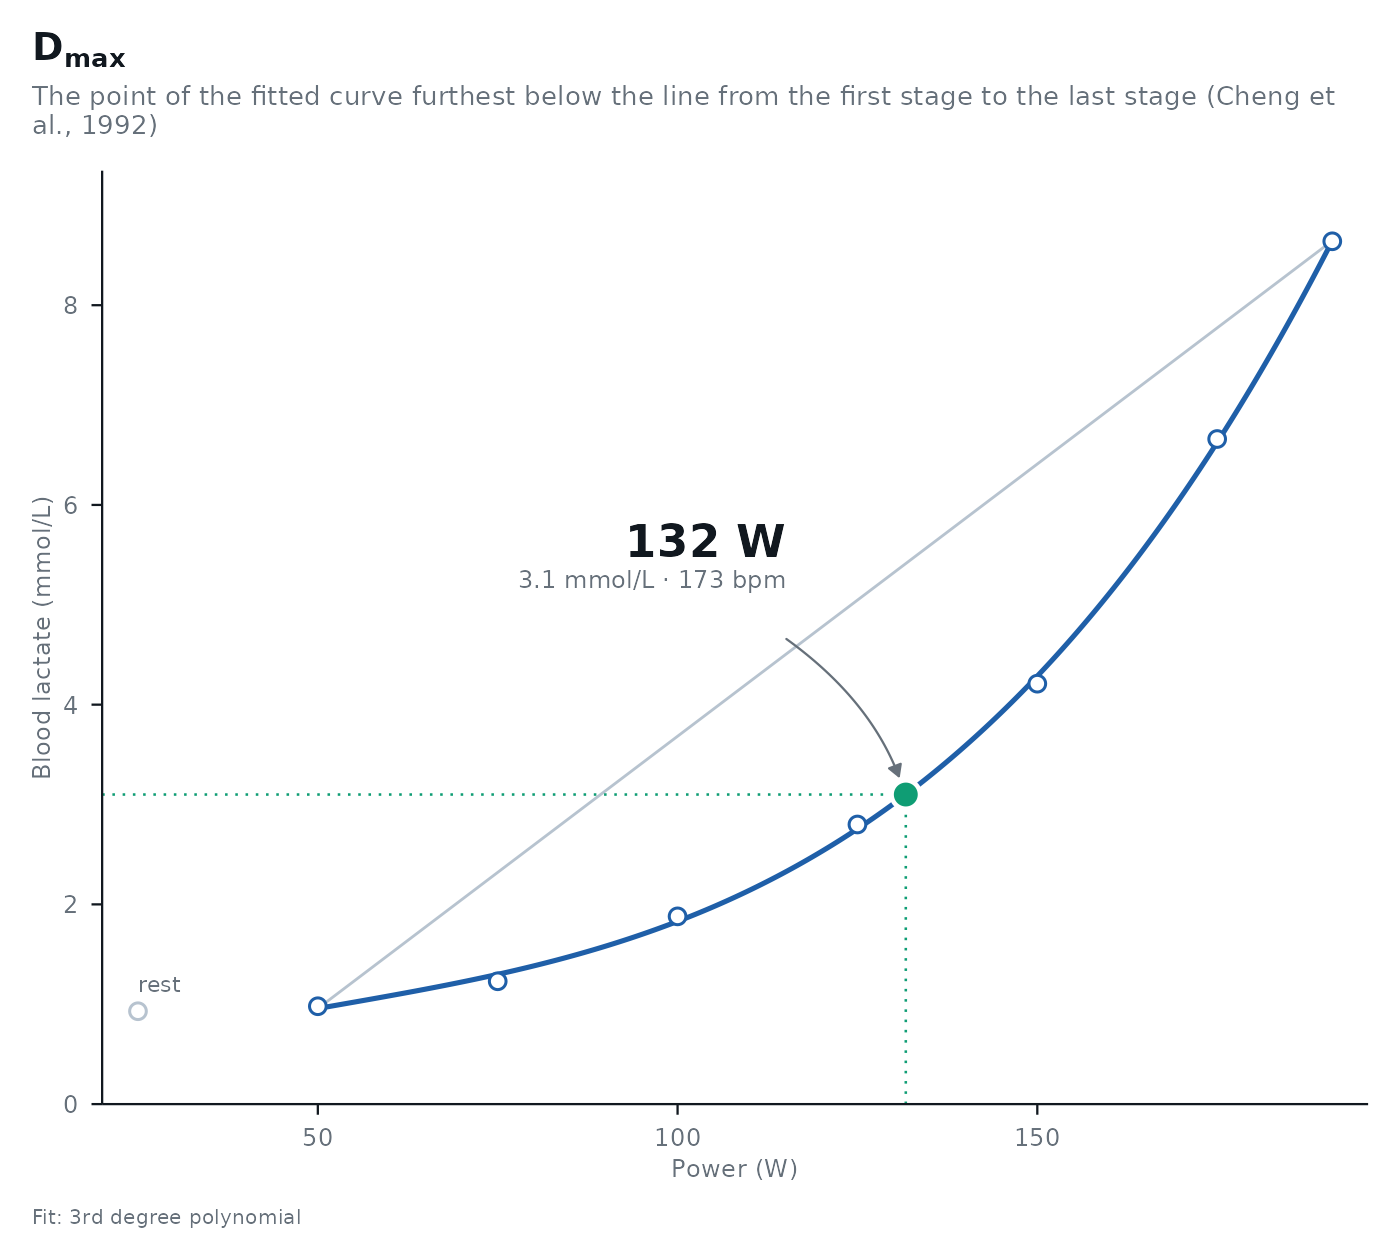
lactate_threshold()) are drawn in green. With method, the plot of that one method:
what the method fitted, the measured stages, and the threshold with its intensity, lactate and
heart rate.
Arguments
- object, x
The result of
lactate_threshold().- method
A method to plot (one of
object$method), orNULLfor the overview.- lt1, lt2
The thresholds that mark LT1 and LT2, drawn in green in the overview. Default to those chosen in
lactate_threshold().- ...
Not used.
Details
The plots are ggplot2 objects: add layers, scales or a theme() to change them. See
theme_lactater() for the dark style (options(lactater.style = "night")) and the font.
Examples
results <- lactate_threshold(
demo_data,
intensity_column = "intensity",
lactate_column = "lactate",
heart_rate_column = "heart_rate",
plot = FALSE
)
autoplot(results)
 autoplot(results, method = "Dmax")